Task 5 — Cluster Monitoring & Telemetry
Cloud Computing SS2026 · Raspberry Pi Edge-Computing Cluster
1. Objective and Delivered Result
The objective of Task 5 was to deploy a centralized monitoring solution for the complete Raspberry Pi cluster. The solution had to observe:
- hardware health,
- relevant operating-system parameters,
- network reachability,
- service availability,
- and failure conditions that require notification.
I implemented the monitoring solution directly on the cluster using the following open-source components:
- Node Exporter for node-level Linux and hardware metrics,
- Prometheus for metric collection, time-series storage, queries, and alert evaluation,
- Blackbox Exporter for ICMP and HTTP availability checks,
- Grafana for dashboards and historical visualization,
- Alertmanager for Telegram notifications.
The final system monitors the Raspberry Pi 5 master, the Raspberry Pi 4 sensor node, and eight Raspberry Pi 3 worker nodes from one central interface.
2. Engineering Work Performed
Task 5 involved more than adding a dashboard. My work included the complete engineering flow:
- I analysed the monitoring requirements and identified the nodes, services, and metrics that had to be observed.
- I reviewed alternative monitoring platforms and selected an architecture suitable for a local Raspberry Pi cluster.
- I designed the monitoring data flow and decided which components would run centrally and which would run on every node.
- I installed Node Exporter as a native Linux service on the cluster nodes.
- I deployed Prometheus, Grafana, Blackbox Exporter, and Alertmanager as Docker containers on the master node.
- I configured scrape targets, external probes, alert rules, Grafana provisioning, and Telegram routing.
- I created and verified dashboard panels for CPU, temperature, memory, disk, network traffic, and load average.
- I tested target availability, probe results, PromQL queries, dashboard updates, and alert states.
- I documented the architecture, verification process, findings, and limitations.
This produced a practical monitoring layer that supports both normal cluster operation and troubleshooting.
3. Technology Evaluation and Selection
Before implementation, I reviewed several monitoring approaches.
| Option | Main strengths | Decision for this project |
|---|---|---|
| Prometheus + Grafana | Open source, self-hosted, strong Linux metrics, time-series queries, alert rules, dashboards, and API integration | Selected because it matches a local Raspberry Pi cluster and can operate without an external cloud platform |
| Datadog | Managed infrastructure monitoring, dashboards, agents, and alerting | Not selected because it depends on an external managed platform and provides more functionality than required for this small local cluster |
| AWS CloudWatch | Strong monitoring for AWS resources, applications, logs, and alarms | Not selected because the project runs on local physical Raspberry Pi nodes rather than AWS infrastructure |
| Checkmk | Self-hosted host and service monitoring with many built-in checks | Considered, but Prometheus provided a simpler time-series API and more direct integration with Grafana and the project frontend |
Why Prometheus and Grafana were selected
The selected stack provided the best balance of:
- open-source licensing,
- local and offline operation,
- low resource usage on worker nodes,
- flexible PromQL queries,
- customizable dashboards,
- service and network probing,
- automated alerting,
- and integration with the existing frontend.
Prometheus and Grafana have separate responsibilities:
Prometheus is the monitoring engine and data source. Grafana is the visualization layer.
4. Scope and Cluster Architecture
The monitoring architecture covers all ten Raspberry Pi nodes in the cluster. Lightweight Node Exporter services run directly on the operating systems, while the central monitoring services run as Docker containers on the Raspberry Pi 5 master node.
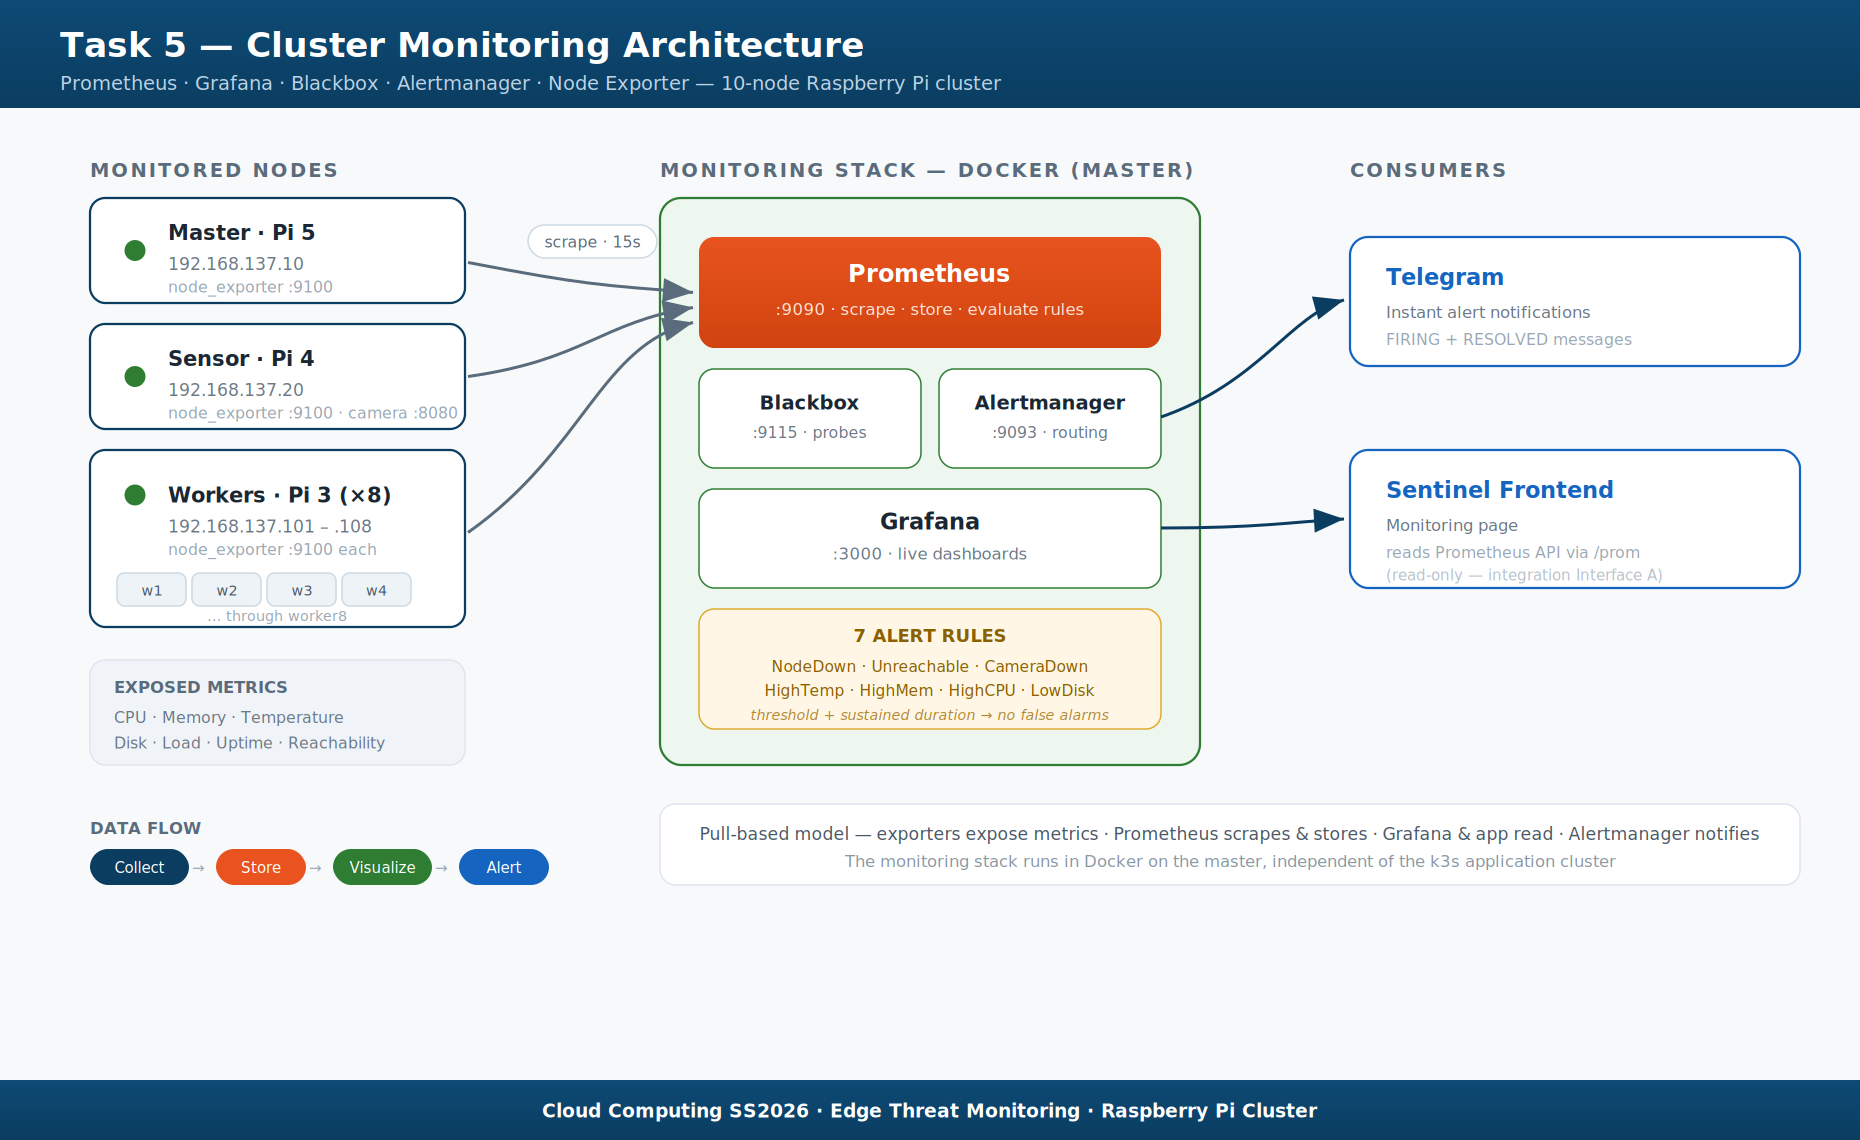
The physical nodes expose internal metrics through Node Exporter. Prometheus collects these metrics every 15 seconds and stores them as time-series data.
Blackbox Exporter adds a second monitoring layer by checking network reachability through ICMP and camera-service availability through HTTP. Grafana and the project frontend query Prometheus for visualization, while Alertmanager forwards firing and resolved alerts to Telegram.
4.1 Monitored node inventory
| Role | Host / address | Hardware | Monitoring method |
|---|---|---|---|
| Master | 192.168.137.10 |
Raspberry Pi 5, 8 GB RAM | Node Exporter and Prometheus self-monitoring |
| Sensor | 192.168.137.20 |
Raspberry Pi 4 with camera | Node Exporter, ICMP probe, and camera HTTP probe |
| Worker 1 | 192.168.137.101 |
Raspberry Pi 3 | Node Exporter and ICMP probe |
| Worker 2 | 192.168.137.102 |
Raspberry Pi 3 | Node Exporter and ICMP probe |
| Worker 3 | 192.168.137.103 |
Raspberry Pi 3 | Node Exporter and ICMP probe |
| Worker 4 | 192.168.137.104 |
Raspberry Pi 3 | Node Exporter and ICMP probe |
| Worker 5 | 192.168.137.105 |
Raspberry Pi 3 | Node Exporter and ICMP probe |
| Worker 6 | 192.168.137.106 |
Raspberry Pi 3 | Node Exporter and ICMP probe |
| Worker 7 | 192.168.137.107 |
Raspberry Pi 3 | Node Exporter and ICMP probe |
| Worker 8 | 192.168.137.108 |
Raspberry Pi 3 | Node Exporter and ICMP probe |
4.2 Prometheus target coverage
The Prometheus configuration contains 21 targets:
- 1 Prometheus self-monitoring target,
- 10 Node Exporter targets,
- 9 ICMP targets,
- 1 camera HTTP target.
4.3 Monitoring service placement
| Component | Location | Port | Responsibility |
|---|---|---|---|
| Node Exporter | Every Raspberry Pi | 9100 |
Exposes internal Linux and hardware metrics |
| Prometheus | Master, Docker | 9090 |
Scrapes, stores, queries, and evaluates metrics |
| Grafana | Master, Docker | 3000 |
Displays dashboards from Prometheus data |
| Blackbox Exporter | Master, Docker | 9115 |
Runs ICMP, TCP, and HTTP probes |
| Alertmanager | Master, Docker | 9093 |
Groups alerts and sends Telegram messages |
5. Final Design Decisions
5.1 Native Node Exporter on each Raspberry Pi
Node Exporter runs directly as a systemd service on every node instead of inside a container. This design:
- reads the real host operating-system metrics,
- avoids requiring Docker on every worker,
- adds only a lightweight monitoring process to the Raspberry Pi 3 nodes,
- and starts with the operating system.
The deployment script first installs Node Exporter on one worker, pauses for verification, and then continues to the remaining nodes. This staged rollout reduces the risk of distributing an incorrect binary or service configuration across the entire cluster.
5.2 Central monitoring stack on the Raspberry Pi 5
Prometheus, Grafana, Blackbox Exporter, and Alertmanager run centrally on the Raspberry Pi 5 master using Docker Compose.
This keeps configuration, dashboards, and alert logic in one location while leaving the worker nodes focused on computation.
5.3 Docker networking and physical cluster addressing
The central containers use Docker service names to communicate with each other:
- Prometheus reaches Alertmanager as
alertmanager:9093. - Prometheus reaches Blackbox Exporter as
blackbox:9115. - Grafana reaches Prometheus as
prometheus:9090.
The physical Raspberry Pi nodes are outside the Docker network, so Prometheus scrapes them through their cluster LAN addresses:
This separation between container service names and physical node IP addresses is important for a reproducible deployment.
5.4 Pull-based collection
Prometheus uses a pull model. Every 15 seconds, it contacts the configured targets and requests their current metrics.
The pull model is useful because a failed scrape is itself a health signal. If an exporter stops responding, Prometheus records up = 0 and can trigger an alert.
5.5 Internal and external health checks
Two monitoring perspectives are combined:
- Node Exporter reports what is happening inside a node.
- Blackbox Exporter tests whether a node or service can be reached from outside.
This distinction matters because a Raspberry Pi may be reachable while its camera application is unavailable, or the node may respond to ping while Node Exporter itself is stopped.
6. Metrics and Queries
| Category | Prometheus metric or calculation | Operational purpose |
|---|---|---|
| Node availability | up{job=~"node-.*"} |
Detect whether Node Exporter can be scraped |
| Network reachability | probe_success{job="blackbox-ping"} |
Detect whether the sensor and workers respond to ICMP |
| Camera availability | probe_success{job="blackbox-http-sensor"} |
Detect whether the camera HTTP service responds |
| CPU usage | Calculated from node_cpu_seconds_total |
Detect sustained processor load |
| Temperature | node_thermal_zone_temp |
Detect overheating risk |
| Memory usage | Calculated from total and available memory | Detect memory pressure |
| Disk usage | Calculated from filesystem size and available bytes | Detect low storage capacity |
| Load average | node_load1 |
Observe runnable and waiting work |
| Network traffic | Receive/transmit byte counters | Observe cluster communication and data transfer |
Example CPU calculation:
Prometheus performs this calculation. Grafana requests and visualizes the result.
7. Grafana Dashboard and Observed Results
The Grafana dashboard provides a central real-time and historical view of the cluster.
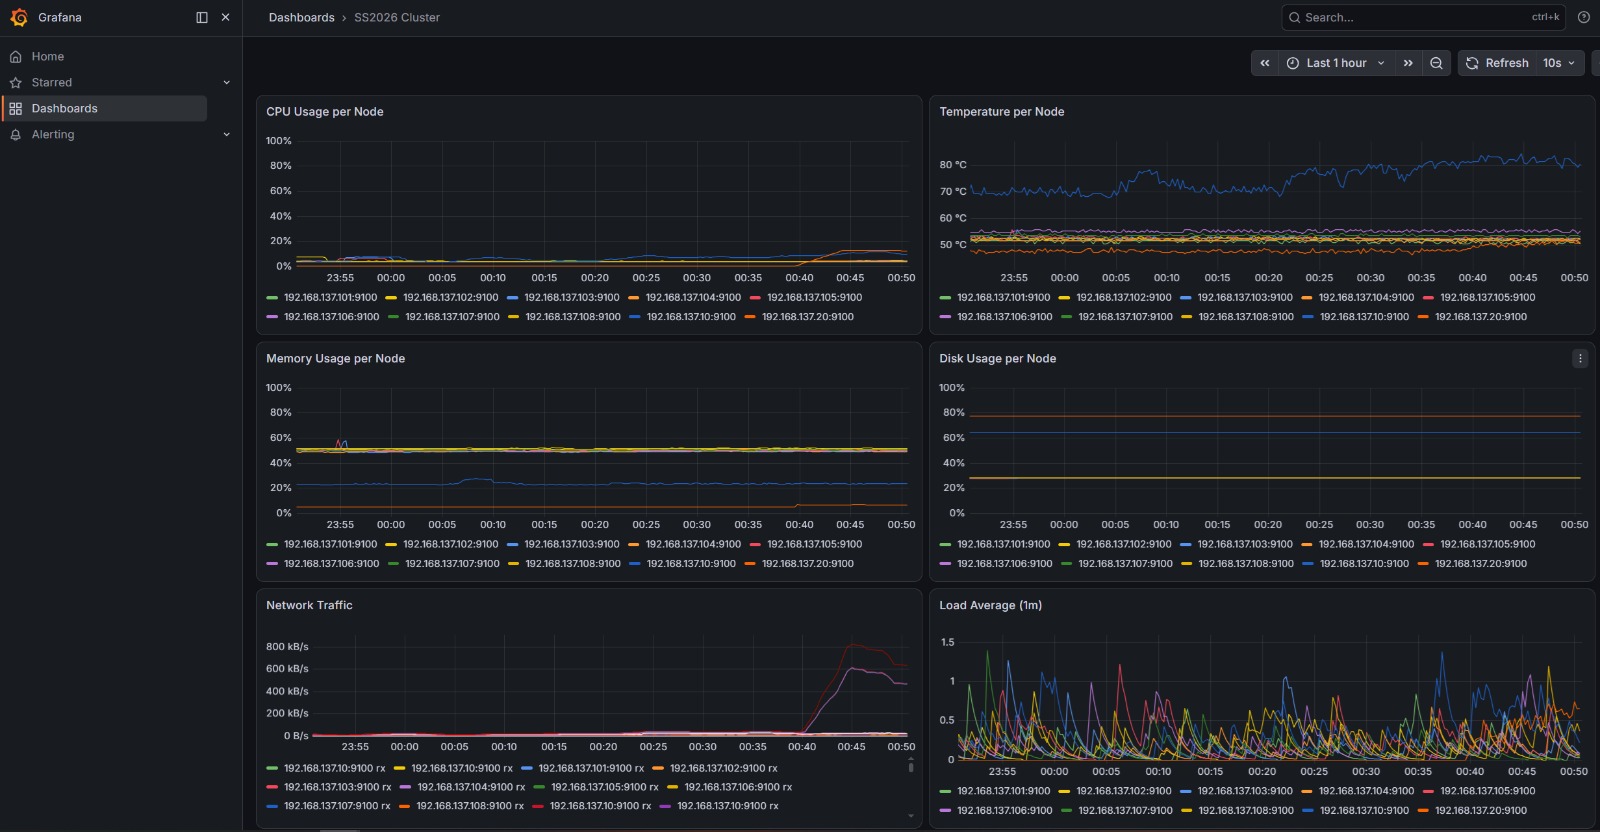
Dashboard panels
| Panel | What it shows | Why it is useful |
|---|---|---|
| CPU Usage per Node | Processor utilization for each Raspberry Pi | Identifies overload and workload distribution |
| Temperature per Node | CPU temperature trends | Detects thermal pressure during computation or inference |
| Memory Usage per Node | Percentage of memory in use | Detects memory pressure and differences between node roles |
| Disk Usage per Node | Root filesystem usage | Warns before storage becomes unavailable |
| Network Traffic | Receive and transmit rates | Shows communication bursts and distributed workload traffic |
| Load Average (1m) | One-minute system load | Shows short-term system pressure beyond simple CPU percentage |
Findings visible in the captured dashboard
The captured data shows real differences between nodes:
- CPU usage remained mostly low during the observation window, with a small increase on selected nodes near the end.
- Most nodes operated around the low-to-mid 50 °C range.
- One node operated considerably hotter, moving into the 70–80 °C range, which supports the configured temperature alert.
- Memory usage differed between node roles and Raspberry Pi models.
- The network panel captured a clear traffic burst on selected nodes.
- Load-average spikes appeared independently across workers, showing short periods of activity.
These observations demonstrate why centralized time-series monitoring is more useful than checking a single current value through SSH.
8. Alert Rules and Notification Flow
The deployed configuration contains seven alert rules.
| Alert | Condition | Required duration | Severity |
|---|---|---|---|
NodeDown |
Node Exporter target returns up == 0 |
30 seconds | Critical |
NodeUnreachable |
ICMP probe returns probe_success == 0 |
30 seconds | Critical |
CameraServiceDown |
Camera HTTP probe returns probe_success == 0 |
30 seconds | Critical |
HighCPUTemperature |
Temperature is above 75 °C | 90 seconds | Warning |
HighMemoryUsage |
Memory usage is above 90% | 90 seconds | Warning |
HighCPULoad |
CPU usage is above 90% | 3 minutes | Warning |
LowDiskSpace |
Root filesystem has less than 15% free space | 5 minutes | Warning |
Alert lifecycle
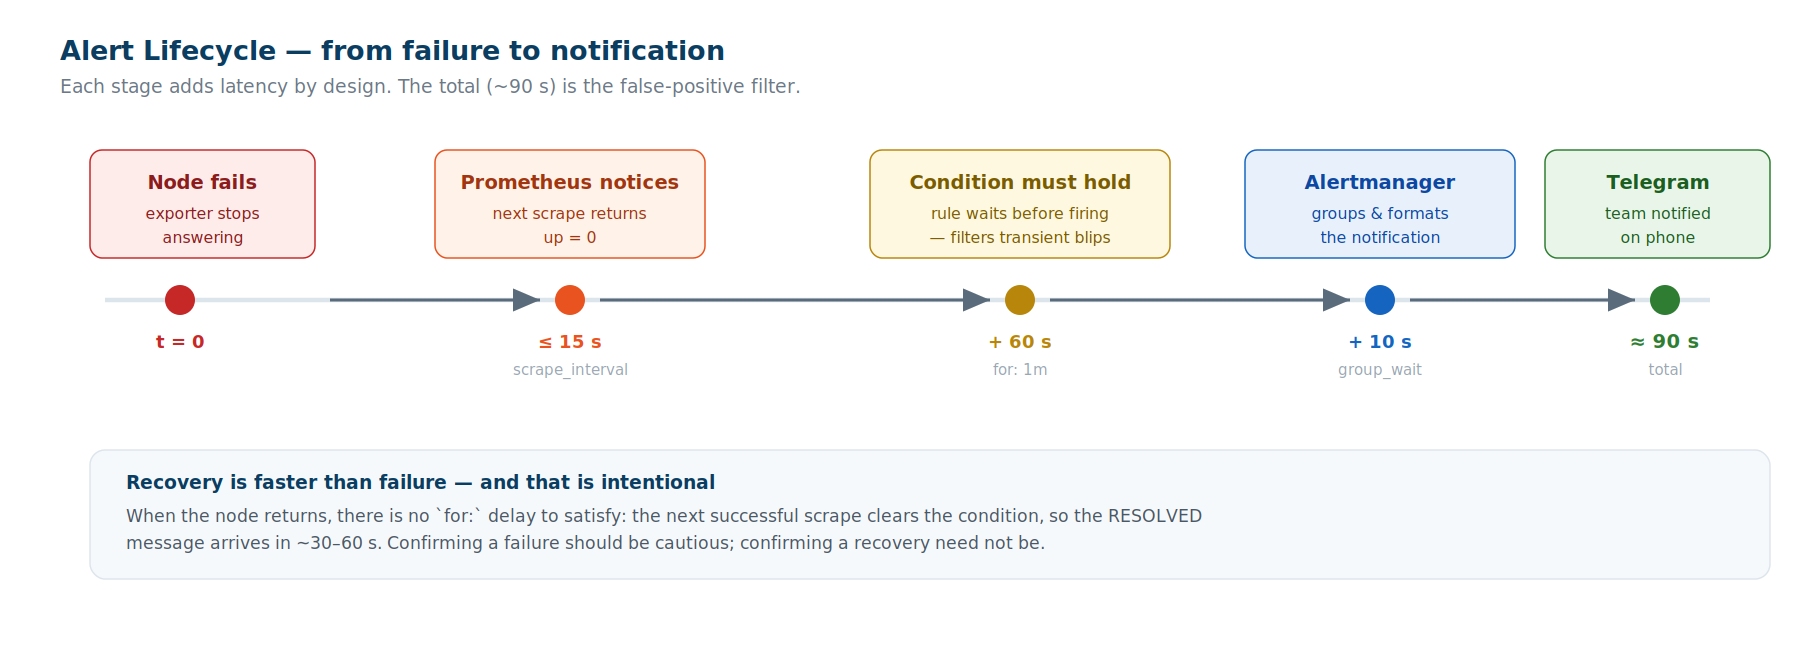
The configured for duration prevents short network interruptions or temporary resource spikes from immediately creating unnecessary alerts.
9. Verification Procedure
9.1 Verify containers
9.2 Verify Prometheus targets
Open:
Or query the API:
The most important node query is:
Interpretation:
9.3 Verify Blackbox probes
Interpretation:
9.4 Verify Grafana
Open:
Verification points:
- expected nodes appear in the legend,
- values update over time,
- the selected time range displays historical trends,
- and changing workloads are visible in the graphs.
9.5 Verify alerts
Alert status can be checked with:
A controlled test can be performed by temporarily stopping Node Exporter on one worker:
After verification, restore it:
The expected sequence is:
10. Results
The implementation achieved the following results:
- centralized monitoring of all ten Raspberry Pi nodes,
- a 15-second metric collection and rule-evaluation interval,
- hardware and Linux operating-system telemetry through Node Exporter,
- network reachability checks through ICMP,
- camera-service availability monitoring through HTTP,
- Prometheus time-series storage and PromQL queries,
- Grafana visualization of current and historical behavior,
- seven infrastructure and resource alert rules,
- Telegram delivery through Alertmanager,
- and read-only monitoring data available to the project frontend.
The system reduces the need to log into each node separately and provides a faster way to identify failures, overheating, resource pressure, and unusual traffic.
11. Repository Structure
master/monitoring/
├── docker-compose.yml
├── install-node-exporters.sh
├── prometheus/
│   ├── prometheus.yml
│   └── alert.rules.yml
├── blackbox/
│   └── blackbox.yml
├── alertmanager/
│   └── alertmanager.yml
└── grafana/
    ├── dashboards/
    │   └── cluster-overview.json
    └── provisioning/
        ├── dashboards/
        │   └── dashboards.yml
        └── datasources/
            └── prometheus.yml
| File | Responsibility |
|---|---|
docker-compose.yml |
Deploys the four central monitoring services |
install-node-exporters.sh |
Downloads and installs Node Exporter on the cluster nodes |
prometheus.yml |
Defines scrape targets, Blackbox probes, and Alertmanager routing |
alert.rules.yml |
Defines alert expressions, thresholds, durations, and severity |
blackbox.yml |
Defines ICMP, TCP, and HTTP probe modules |
alertmanager.yml |
Defines grouping, timing, Telegram receiver, and message format |
Grafana provisioning prometheus.yml |
Registers Prometheus as the Grafana data source |
cluster-overview.json |
Stores the Grafana dashboard definition |
12. Limitations and Future Improvements
The current monitoring design is centralized on the Raspberry Pi 5 master node. This was a suitable decision for the project because the cluster is small, the master has the strongest hardware, and centralizing Prometheus, Grafana, Blackbox Exporter, and Alertmanager keeps the setup simple, lightweight, and easy to manage.
The system fully meets the current Task 5 requirements by monitoring all cluster nodes, collecting hardware and operating-system metrics, checking network and camera-service availability, displaying dashboards, and sending alerts.
One future improvement would be to run a backup monitoring instance on another physical device. The backup instance could monitor the master node and continue collecting metrics and sending alerts if the master became unavailable.
This would remove the master as the single point of failure for monitoring and improve overall availability without changing the current monitoring architecture.
13. Conclusion
Task 5 delivered a working monitoring and telemetry solution for the Raspberry Pi edge-computing cluster.
The implementation combines:
- Node Exporter for internal node metrics,
- Prometheus for collection, storage, PromQL, and alert evaluation,
- Blackbox Exporter for external availability checks,
- Grafana for dashboards,
- Alertmanager for Telegram notifications.
The selected design is open source, self-hosted, appropriate for resource-constrained Raspberry Pi hardware, and technically integrated with the wider project.
It improves visibility across the cluster and provides a repeatable process for detecting node failures, service failures, thermal issues, and resource pressure.